多机负载
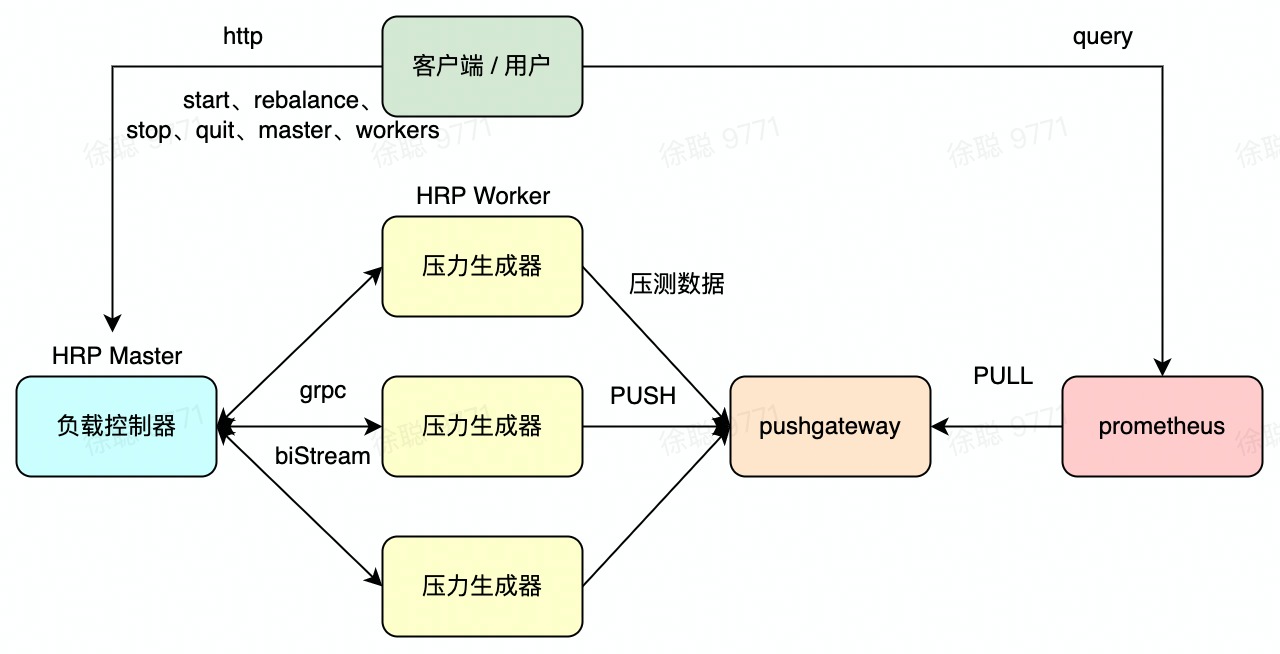
HttpRunner v4.2 起,hrp 可支持 master (负载控制器) 与 worker (压力生成器) 模式下启动,基于「一主多从」的负载加压模式实现海量并发。
功能特性
- 支持使用 auto-start / http-api 控制压测流程
- 支持任务自动下发(e.g. 参数化、自定义函数)
- 支持动态调整worker节点的并发用户数,(当前策略:全部 worker 均分并发用户数)
- 支持指定循环次数
- 支持 worker 常驻、不退出策略,自动重连,且无需关心 master 与 worker 启动顺序
- 支持在开始性能测试时更改 prometheus-gateway 地址
架构图
总体框架
runner 状态机
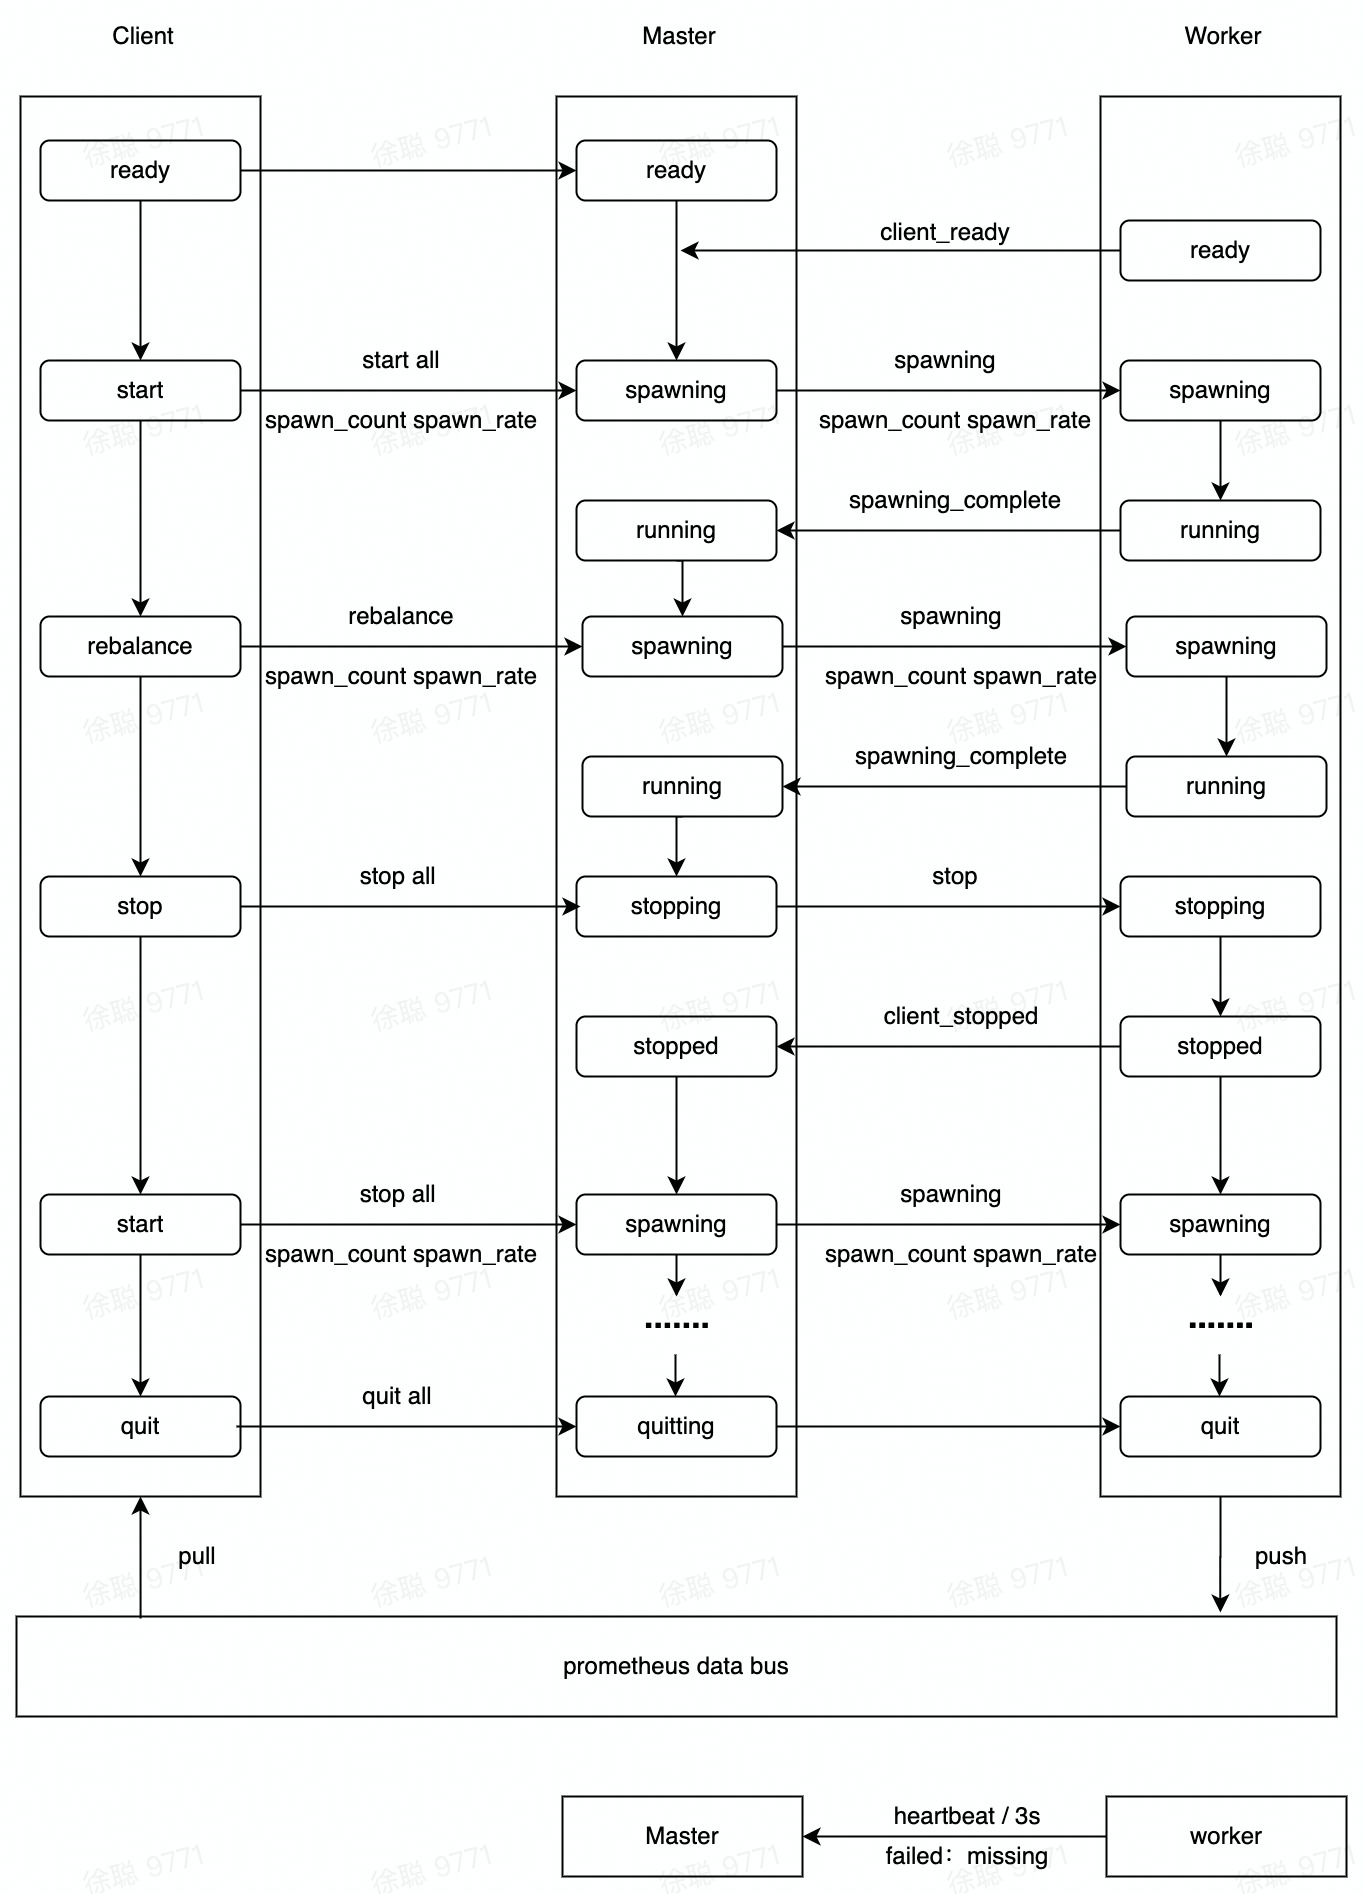
状态说明:
| 状态 | 说明 |
|---|---|
| ready | master 与 worker 启动后的默认状态 |
| spawning | 正在生成并发用户,达到最大并发用户数之前的状态 |
| running | 正在压测 |
| stopping | worker 停止压测的中间状态 |
| stopped | 压测已经停止 |
| quitting | master 通知 worker 退出,worker 即将退出的中间状态 |
| missing | 丢失状态,master 默认 3 秒没有收到 worker 的心跳,就会置 worker 状态为 missing,worker 独有状态 |
快速上手
准备工作
在各个节点上运行 HttpRunner Master 与 Worker 实例,完成性能测试前的准备工作。
运行 Master
自动开始模式
此模式下,需在启动 master 时设置自动开始的条件,如果条件满足则自动开始执行性能测试任务,如果条件不满足,会在设置的超时时间内自动结束。使用示例如下:
hrp boom testcase --master --auto-start --master-bind-host 0.0.0.0 --master-bind-port 5557 --expect-workers 2 --expect-workers-max-wait 120 --spawn-count 100 --spawn-rate 100 --prometheus-gateway ":5331"
说明:
- –master-bind-host 与 –master-bind-port 为 master 提供 worker 连接的地址,默认: 0.0.0.0 与 5557
- –auto-start 设置自动开始,需指定 –expect-workers、–expect-workers-max-wait 两个参数设置自动开始条件与等待超时时间
- –spawn-count、 –spawn-rate 与 –prometheus-gateway 等可设置的运行配置与单机默认一致
API 操控模式
此模式下,master 会提供 HTTP API 接口,用于控制整个性能测试过程。使用下面命令启动 hrp master。
hrp boom --master --master-bind-host 0.0.0.0 --master-bind-port 5557 --master-http-address "0.0.0.0:9771"
参数说明:
- –master-bind-host 与 –master-bind-port 为 master 提供 worker 连接的地址,默认: 0.0.0.0 与 5557
- –master-http-address 为控制 master 的 http api 地址,默认: 0.0.0.0:9771
- 启动时,不需要设置运行参数,运行配置全部调用 api 指定
运行 Worker
worker启动时,无需配置任何性能测试运行参数,运行参数全部从 master 端获取。
hrp boom --worker --master-host 0.0.0.0 --master-port 5557 --ignore-quit
说明:
- –master-host、–master-port 为 master 提供 worker 连接的地址,默认: 0.0.0.0 与 5557
- –ignore-quit 添加后会忽略 master 的 quit 信号,在 master 再次启动后,worker 自动重接
性能测试
自动开始模式
此模式下,仅支持执行指定的性能测试场景,不支持动态调整并发用户数,适合明确测试任务的单次执行场景。
开始
当期望 worker 数达到时,master 会自动下发启动时指定的性能测试配置至 worker 端,自动开始执行。
结束
使用 kill / Ctrl + C 命令退出 master 即可结束性能测试。
API 操控模式
此模式下,master 提供六个接口,用于控制性能测试全流程,curl 命令示例如下:
开始
开始压测,必须指定 testcase 路径,如果 prometheus-gateway 设置的 ip 缺省,例如: “:5331”,则默认使用 master ip 地址
curl --location --request POST 'http://127.0.0.1:9771/start' \
--header 'Content-Type: application/json' \
--data-raw '{
   "spawn-count": 1000,
   "spawn-rate": 1000,
   "prometheus-gateway": "192.168.11.122:5331",
   "testcase-path": "path/to/testcase"
}'
支持参数:
type Profile struct {
   SpawnCount               int64         `json:"spawn-count,omitempty" yaml:"spawn-count,omitempty" mapstructure:"spawn-count,omitempty"`
   SpawnRate                float64       `json:"spawn-rate,omitempty" yaml:"spawn-rate,omitempty" mapstructure:"spawn-rate,omitempty"`
   MaxRPS                   int64         `json:"max-rps,omitempty" yaml:"max-rps,omitempty" mapstructure:"max-rps,omitempty"`
   LoopCount                int64         `json:"loop-count,omitempty" yaml:"loop-count,omitempty" mapstructure:"loop-count,omitempty"`
   RequestIncreaseRate      string        `json:"request-increase-rate,omitempty" yaml:"request-increase-rate,omitempty" mapstructure:"request-increase-rate,omitempty"`
   MemoryProfile            string        `json:"memory-profile,omitempty" yaml:"memory-profile,omitempty" mapstructure:"memory-profile,omitempty"`
   MemoryProfileDuration    time.Duration `json:"memory-profile-duration,omitempty" yaml:"memory-profile-duration,omitempty" mapstructure:"memory-profile-duration,omitempty"`
   CPUProfile               string        `json:"cpu-profile,omitempty" yaml:"cpu-profile,omitempty" mapstructure:"cpu-profile,omitempty"`
   CPUProfileDuration       time.Duration `json:"cpu-profile-duration,omitempty" yaml:"cpu-profile-duration,omitempty" mapstructure:"cpu-profile-duration,omitempty"`
   PrometheusPushgatewayURL string        `json:"prometheus-gateway,omitempty" yaml:"prometheus-gateway,omitempty" mapstructure:"prometheus-gateway,omitempty"`
   DisableConsoleOutput     bool          `json:"disable-console-output,omitempty" yaml:"disable-console-output,omitempty" mapstructure:"disable-console-output,omitempty"`
   DisableCompression       bool          `json:"disable-compression,omitempty" yaml:"disable-compression,omitempty" mapstructure:"disable-compression,omitempty"`
   DisableKeepalive         bool          `json:"disable-keepalive,omitempty" yaml:"disable-keepalive,omitempty" mapstructure:"disable-keepalive,omitempty"`
}
动态调整
在 running 状态下可支持动态调整 worker 的最大并发用户数
curl --location --request POST 'http://127.0.0.1:9771/rebalance' \
--header 'Content-Type: application/json' \
--data-raw '{
   "spawn-count": 5000,
   "spawn-rate": 5000
}'
支持参数:
type Profile struct {
   SpawnCount   int64    `json:"spawn-count,omitempty" yaml:"spawn-count,omitempty" mapstructure:"spawn-count,omitempty"`
   SpawnRate    float64  `json:"spawn-rate,omitempty" yaml:"spawn-rate,omitempty" mapstructure:"spawn-rate,omitempty"`
}
获取 Worker 信息
获取全部 worker 信息,包括 worker 的当前执行并发用户数、运行状态、cpu usage、memory usage 等信息
curl --location --request GET 'http://127.0.0.1:9771/workers'
获取 Master 信息
获取 master 的状态信息
curl --location --request GET 'http://127.0.0.1:9771/master'
停止
停止本次压测,仅当 spawning 与 running 状态下使用
curl --location --request GET 'http://127.0.0.1:9771/stop'
结束
使用 /quit 接口,退出 master,同时,会通知 worker 退出
curl --location --request GET 'http://127.0.0.1:9771/quit'
性能监控
结合 Prometheus + Grafana 看板,实现 Web 化的实时监控指标展示。关于 Prometheus + Grafana 的性能监控配置方面的内容,详见监控配置。
效果如下所示:
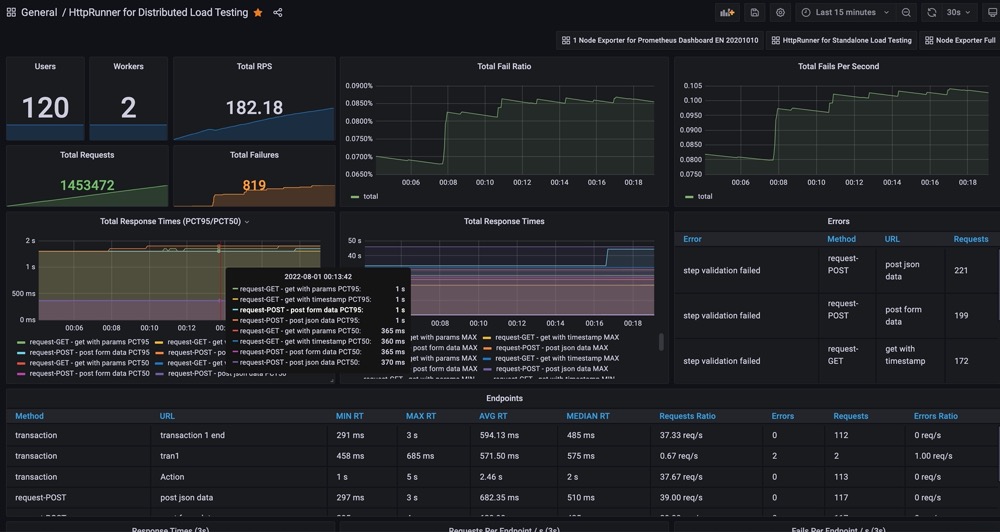
大家在 HttpRunner 公众号回复「Grafana」获取模板下载地址,然后导入 Grafana 中即可使用。

注意事项
如果用户在测试用例中使用到自定义函数功能,需要注意如下两点:
- python 自定义函数,用到的函数需要全部写在 debugtalk.py 中,且不支持引用第三方依赖
- golang 自定义函数,需要保证 worker 与 master 系统以及架构一致,这是由于 master 节点在下发任务前就会编译 golang plugin
目前,v4.2.0 版本分布式性能测试,使用自定义函数部分还存在较多限制,提供几点建议:
- 如果 master 与 worker 能保证系统与架构统一,建议使用 golang 自定义函数,优点:执行效率更高、worker 无需具备 golang 编译环境
- 如果 master 与 worker 系统与架构不能做到统一,推荐使用 python 自定义函数,但有个前提是: 如果用到第三方依赖,需要提前在 worker 节点 ~/.hrp/venv python虚拟环境中中安装依赖