性能监控
快速上手
本节将介绍如何从零搭建 Prometheus 服务,打通性能监控链路,帮助大家能快速上手。
配置Prometheus
在官网 Download | Prometheus 下载 prometheus 与 pushgateway,并进行如下配置。
Pushgateway
Pushgateway 不需要修改任何配置文件,直接运行可执行文件即可启动,默认端口号为 9091,如需更改端口号,需启动时指定。启动 Pushgateway:
./pushgateway --web.listen-address=":9091"
Prometheus Server
启动 Server 前需要手动更改 prometheus.yml 配置文件,明确拉取指标的实例地址(本案例中的 Pushgateway 地址)与 Server 拉取 Pushgateway 实例的时间间隔( scrape_interval ),具体更改如下:
global:
  scrape_interval:     15s # By default, scrape targets every 15 seconds.
  evaluation_interval: 15s # Evaluate rules every 15 seconds.
  # Attach these extra labels to all timeseries collected by this Prometheus instance.
  external_labels:
    monitor: 'codelab-monitor'

rule_files:
  - 'prometheus.rules.yml'

scrape_configs:
  - job_name: 'prometheus'
    # Override the global default and scrape targets from this job every 5 seconds.
    scrape_interval: 5s

    static_configs:
      - targets: ['localhost:9090']

  - job_name: 'pushgateway'  # metrics_path defaults to '/metrics'  # scheme defaults to 'http'.
    scrape_interval: 3s
    static_configs:
      - targets: ['localhost:9091']
        labels:
          instance: httprunner
注意:Pushgateway 的 scrape_interval 需要与 HttpRunner 上报数据频率保持一致,即设置为 3s。
启动 Prometheus Server:
./prometheus --config.file=prometheus.yml
配置HttpRunner
配置 HttpRunner 就比较简单了,在使用 hrp boom 启动性能测试时通过 prometheus-gateway 参数设置 Pushgateway 地址即可,如 --prometheus-gateway=":9091"。在性能过程中,HttpRunner 会以 3s 的数据上报间隔将性能测试指标上报到 Pushgateway。
配置Grafana
Grafana 的快速上手可以参考:Grafana | Prometheus ,不再赘述。
本文提供 hrp boom 单机模式的 Dashboard 模板,大家在 HttpRunner 公众号回复「Grafana」获取模板下载地址,然后导入 Grafana 中即可使用。
注:分布式场景的 Grafana Dashboard 模板,待 HttpRunner 上线分布式性能测试能力后再提供。

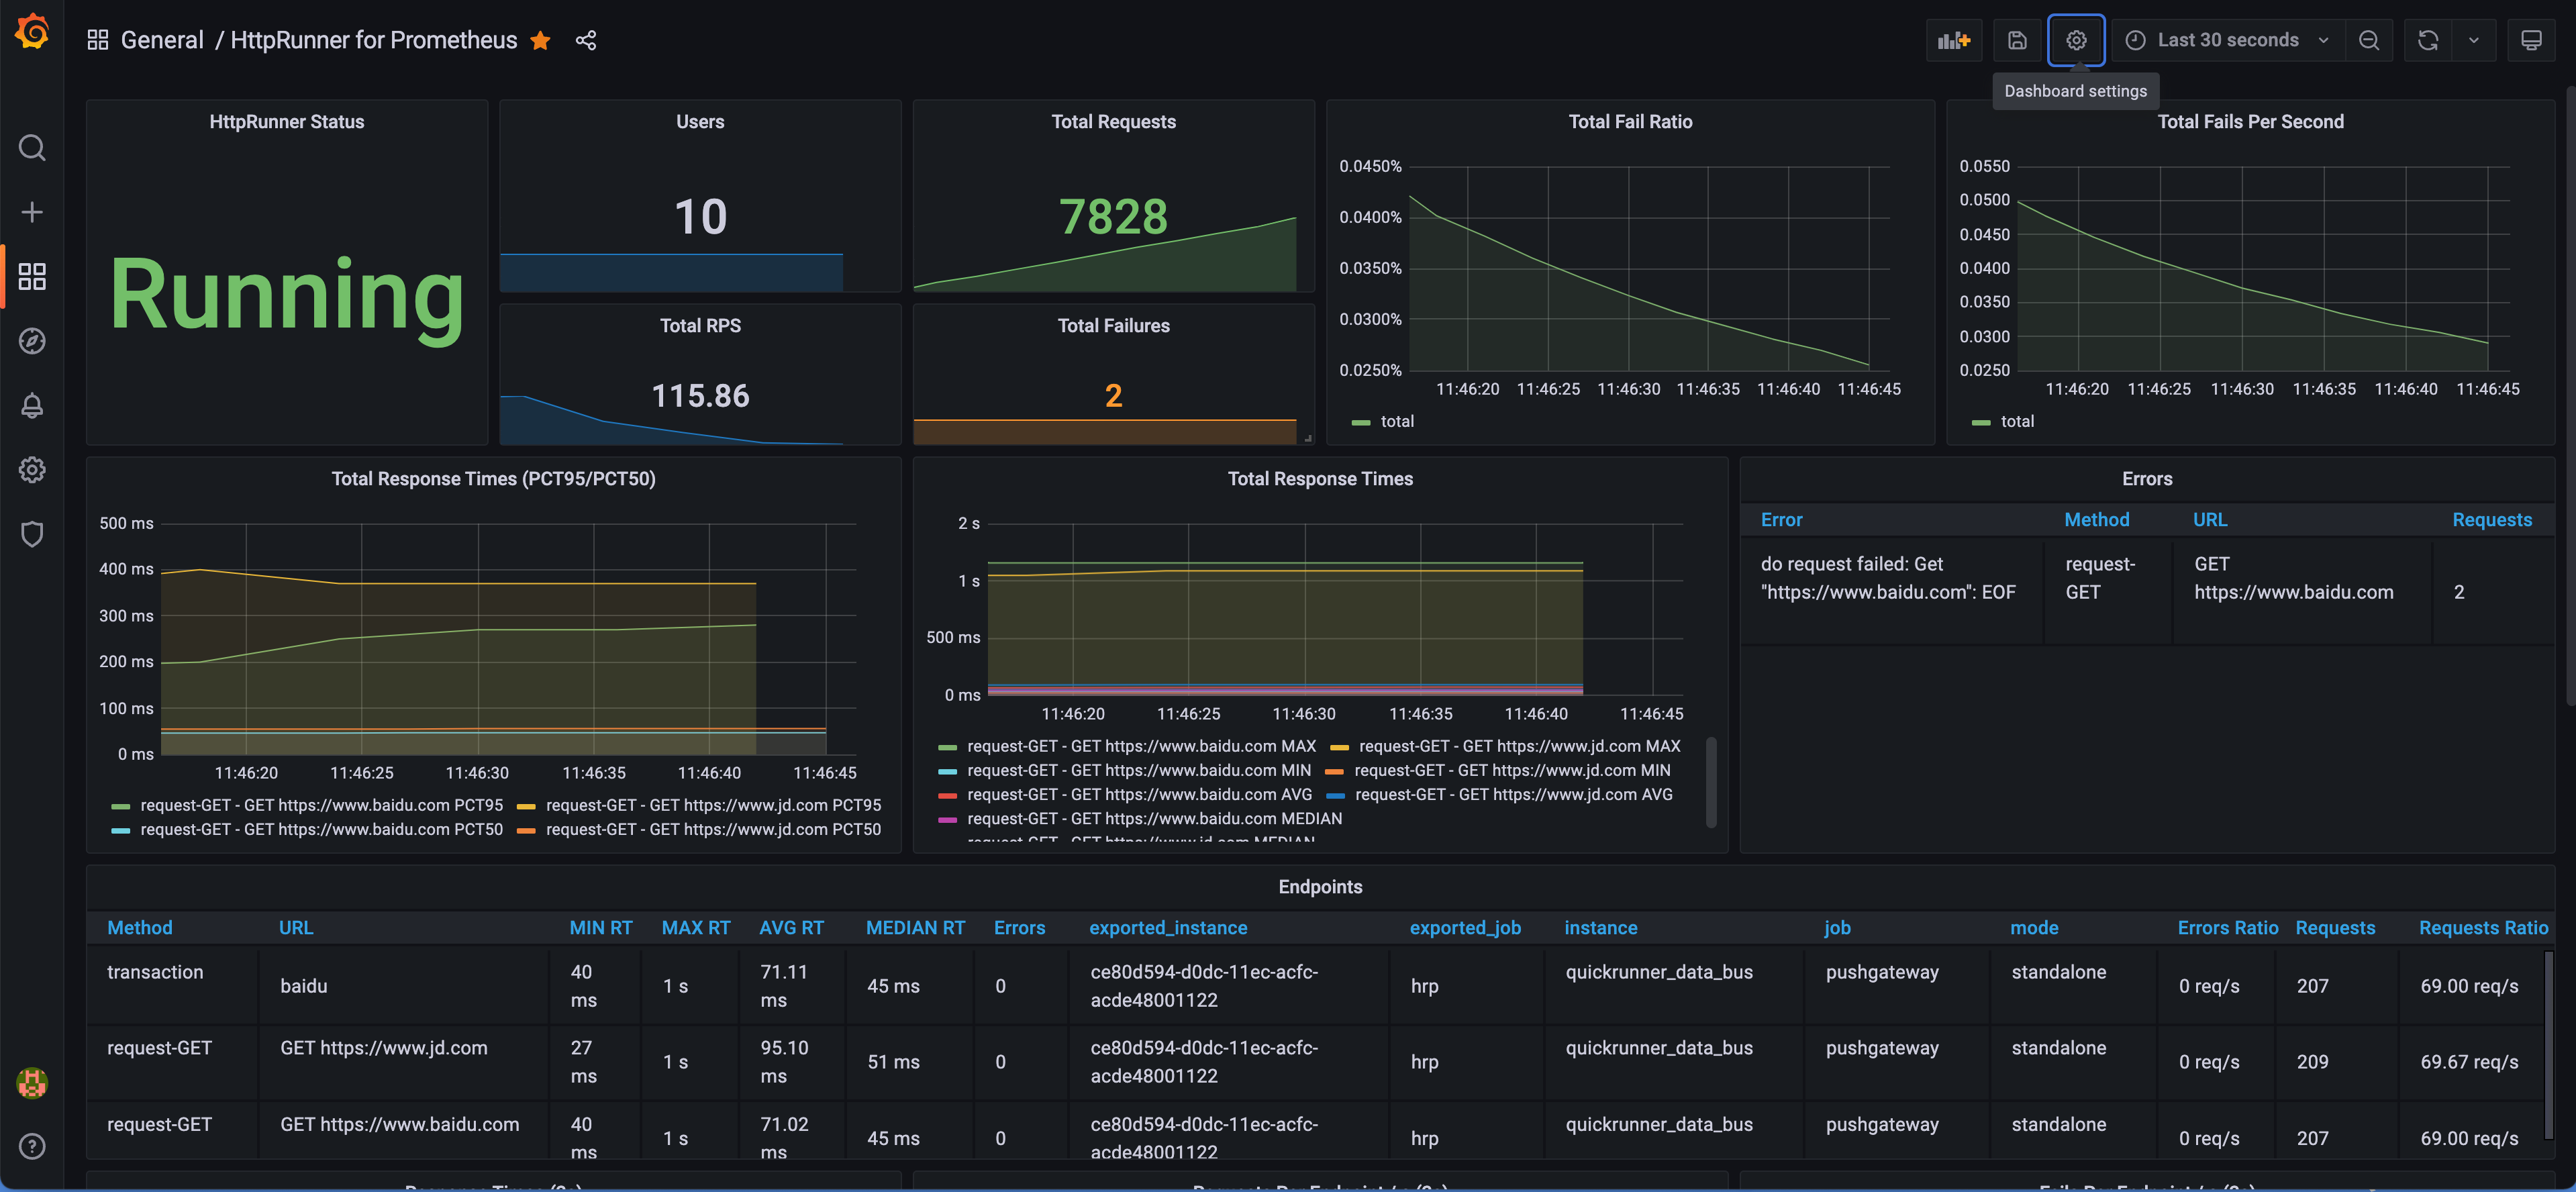
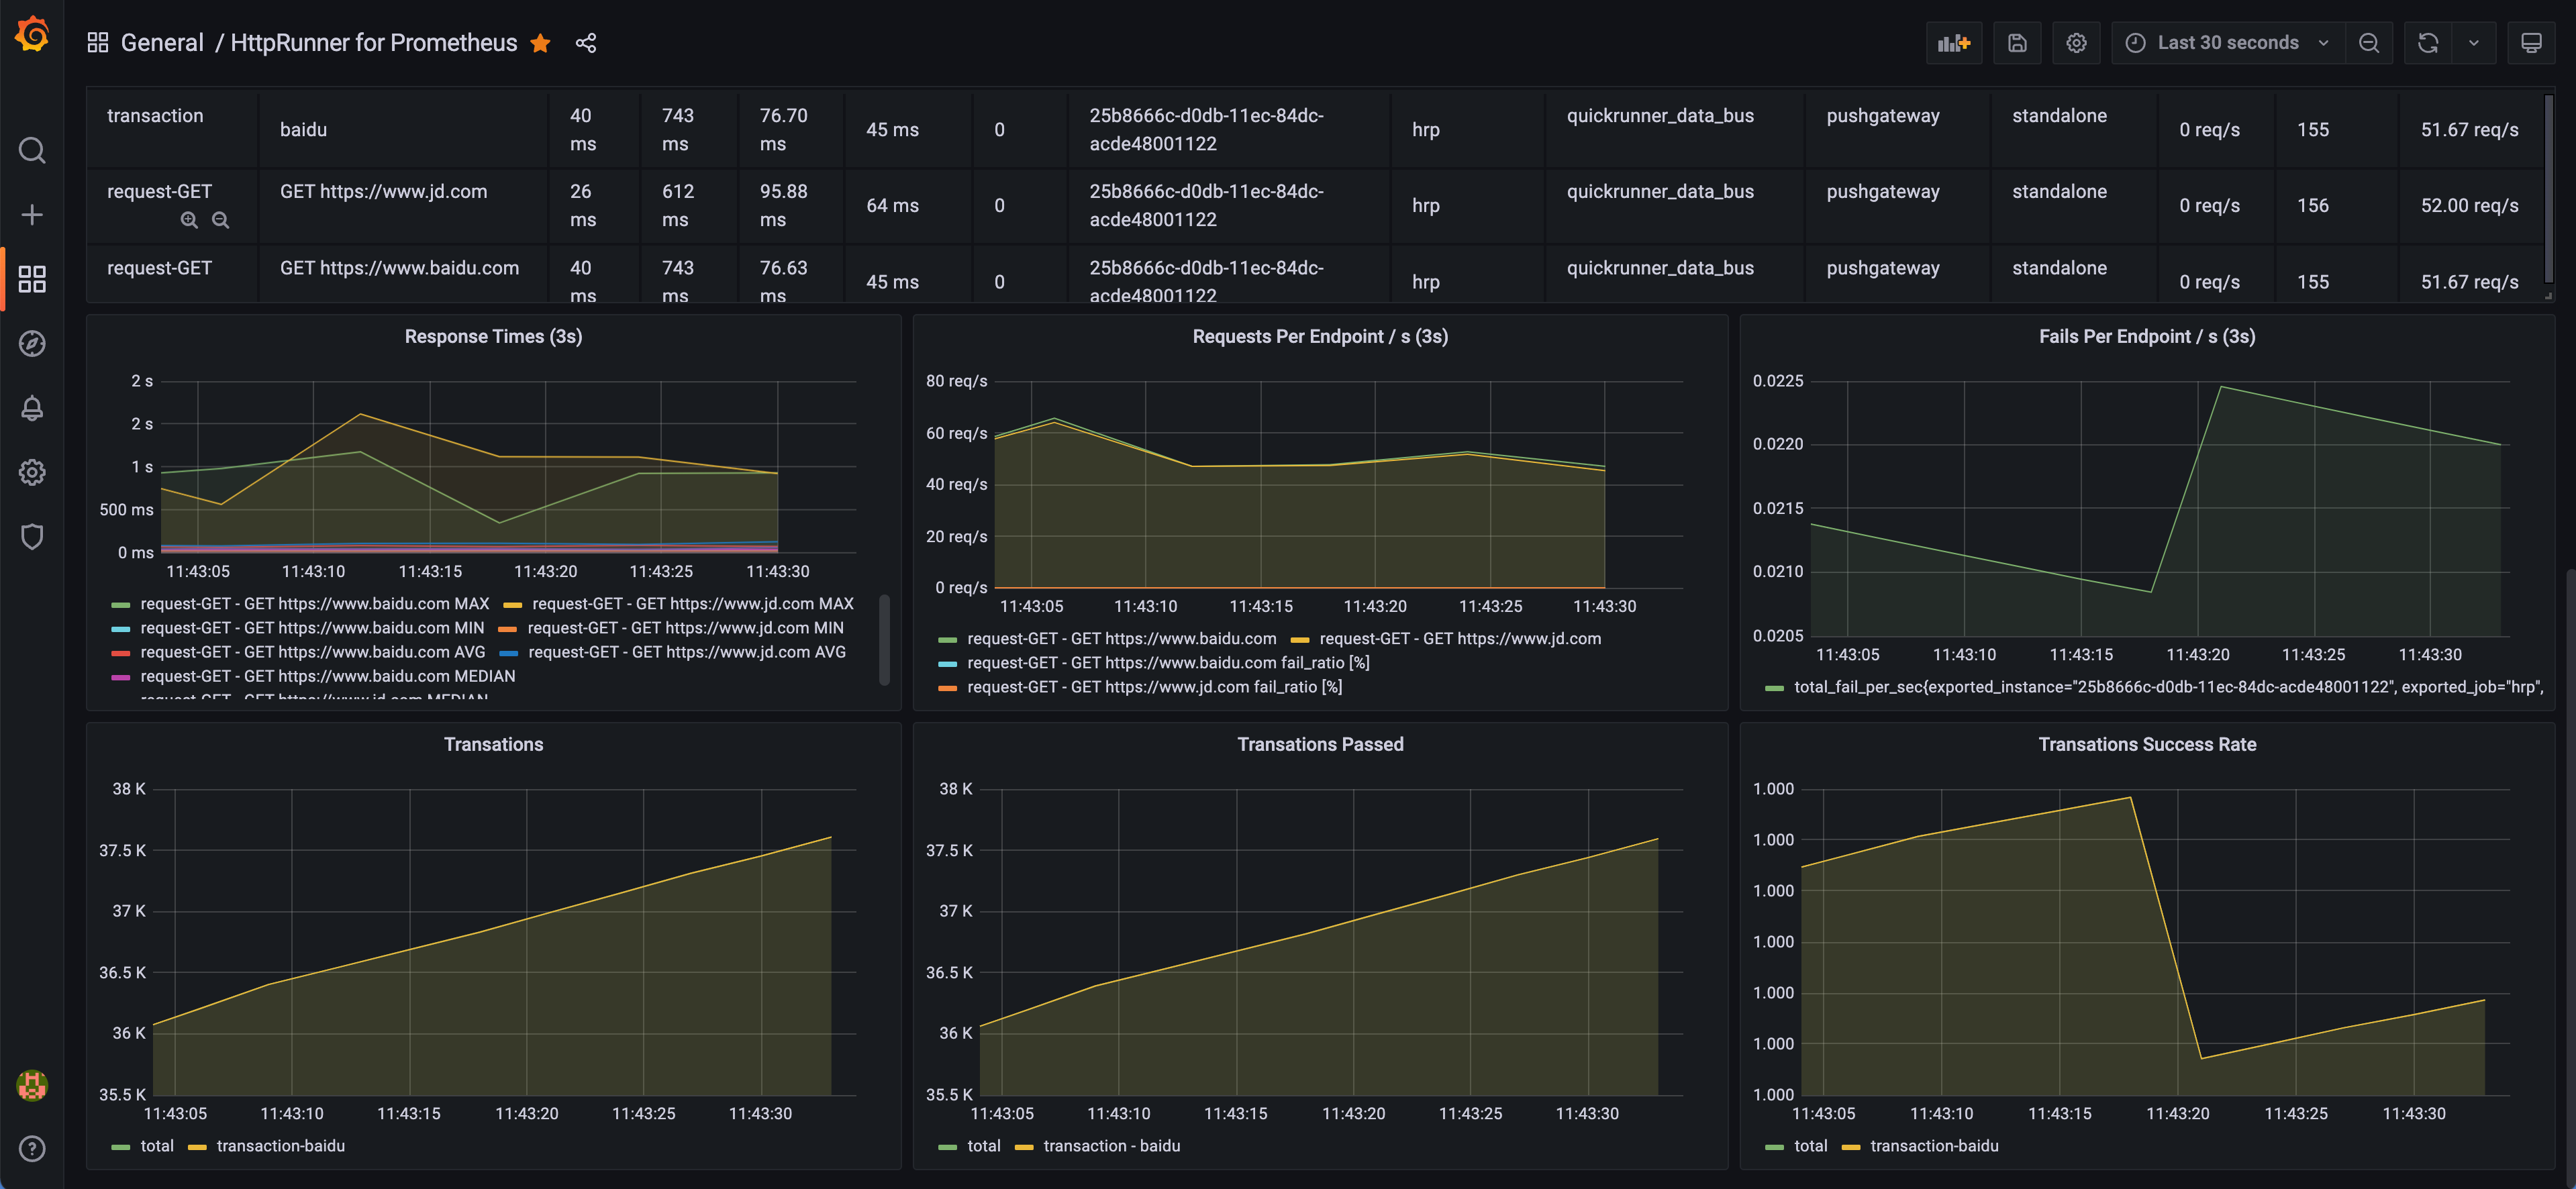
模板最终效果如下:
指标说明
本节将介绍 HttpRunner 上报的指标说明,大家可以根据需要再丰富本文提供的 Grafana Dashboard 模板。
HttpRunner 上报至 Prometheus 指标具体可分为两大类:
- 3s统计间隔内的性能测试指标,可实时监控最新性能数据详情
- 整体性能测试指标,可实时监控测试过程的整体性能指标
指标名称与具体说明如下:
| 指标名称 | 指标说明 | 指标类型 | 标签 | 统计间隔 |
|---|---|---|---|---|
| num_requests | The number of requests | GaugeVec | name、method | 3s |
| num_failures | The number of failures | GaugeVec | name、method | 3s |
| median_response_time | The median response time | GaugeVec | name、method | 3s |
| average_response_time | The average response time | GaugeVec | name、method | 3s |
| min_response_time | The min response time | GaugeVec | name、method | 3s |
| max_response_time | The max response time | GaugeVec | name、method | 3s |
| average_content_length | The average content length | GaugeVec | name、method | 3s |
| current_rps | The current requests per second | GaugeVec | name、method | 3s |
| current_fail_per_sec | The current failure number per second | GaugeVec | name、method | 3s |
| total_num_requests | The number of requests in total | CounterVec | method、name | total |
| total_num_failures | The number of failures in total | CounterVec | method、name | total |
| errors | The errors of load testing | CounterVec | method、name、error | total |
| response_time | The summary of response time(PCT50/PCT90/PCT95) | SummaryVec | name、method | total |
| users | The current number of users | Gauge | N/A | total |
| state | The current runner state, 1=initializing, 2=spawning, 3=running, 4=quitting, 5=stopped | Gauge | N/A | total |
| duration | The duration of load testing | Gauge | N/A | total |
| total_average_response_time | The average response time in total milliseconds | Gauge | N/A | total |
| total_min_response_time | The min response time in total milliseconds | GaugeVec | name、method | total |
| total_max_response_time | The max response time in total milliseconds | GaugeVec | name、method | total |
| total_rps | The requests per second in total | Gauge | N/A | total |
| fail_ratio | The ratio of request failures in total | Gauge | N/A | total |
| total_fail_per_sec | The failure number per second in total | Gauge | N/A | total |
| transactions_passed | The accumulated number of passed transactions | Gauge | N/A | total |
| transactions_failed | The accumulated number of failed transactions | Gauge | N/A | total |